In February, out of concern that the US is experiencing a new crime wave, I blogged about a data set Open Phil assembled on crime in major American cities. In comparison with the FBI’s widely cited national totals, our data covered far less territory—18 cities for which we found daily incident data—but did better in the time dimension, with higher resolution and more up-to-date counts. We could compute daily totals, and from data sets that for many cities are almost literally up-to-the-minute.
Some places that have recently made national crime news also appear in our data, including Baltimore, Chicago, St. Louis, and Washington, DC. Within our geographic scope, we gain a better view into the latest trends than we can get from the FBI’s annual totals, which appear with a long lag.
Indeed the FBI will probably release its 2015 crime totals in the next few days, which may stoke discussion about crime in the US. [Update: it just did].
In this post, I update all the graphs presented in the earlier one, which I suggest you read first. These updates generate predictions about what the FBI will announce, and perhaps point to one trend that it won’t yet discern.
With 8 more months of data on these 18 cities, plus the addition of New York for 2006–15, the main updates on per-capita crime rates are:
- On a population-weighted basis, the hints in the old post of decline at the end of 2015, in violent crime in general and homicide in particular, have faded—or at least have been pushed forward in time.
- Instead, after the homicide rise of late 2014 and 2015—which indeed was one of the largest increases in modern times—the homicide trend has flattened.
- Violent crime rose slowly, as it has since mid-2014. It remains low historically, down roughly a third since 2001.
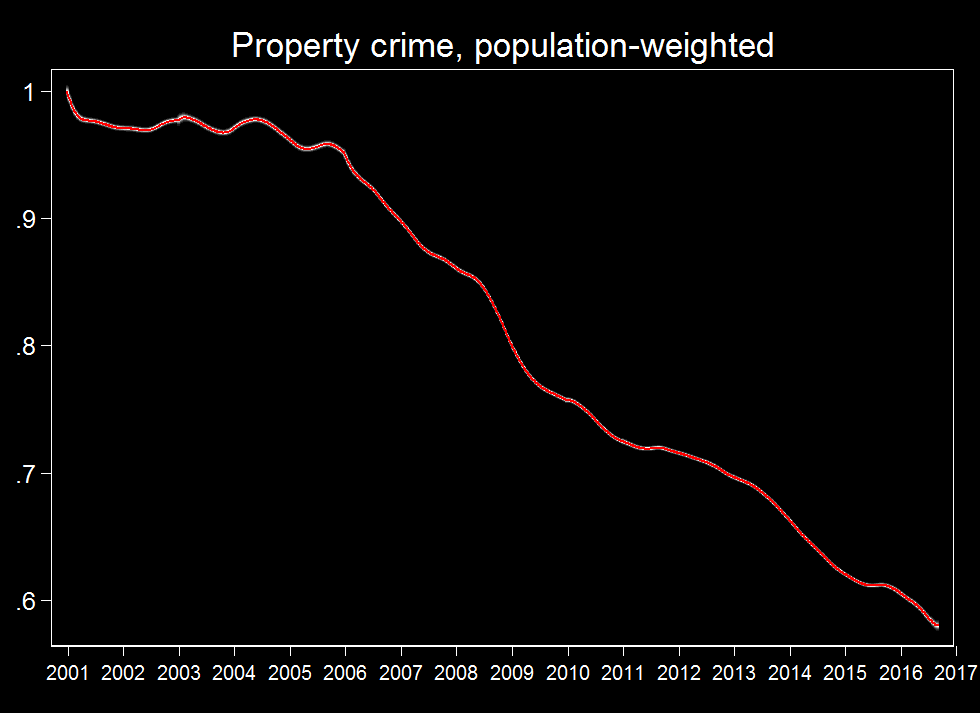
- Property crime (burglary, theft, arson) continues to sink like a stone.
If our data capture national trends (which is far from certain), then the FBI will soon report that the 2015 homicide rate rose a lot from 2014, that violent crime rose a little bit, that property crime fell, and that total crime, which is dominated in sheer quantity by property crime, also fell. [Update: these look right.]
Here are the Open Phil graphs, updated through a few weeks ago and starting with homicide (data and code here):
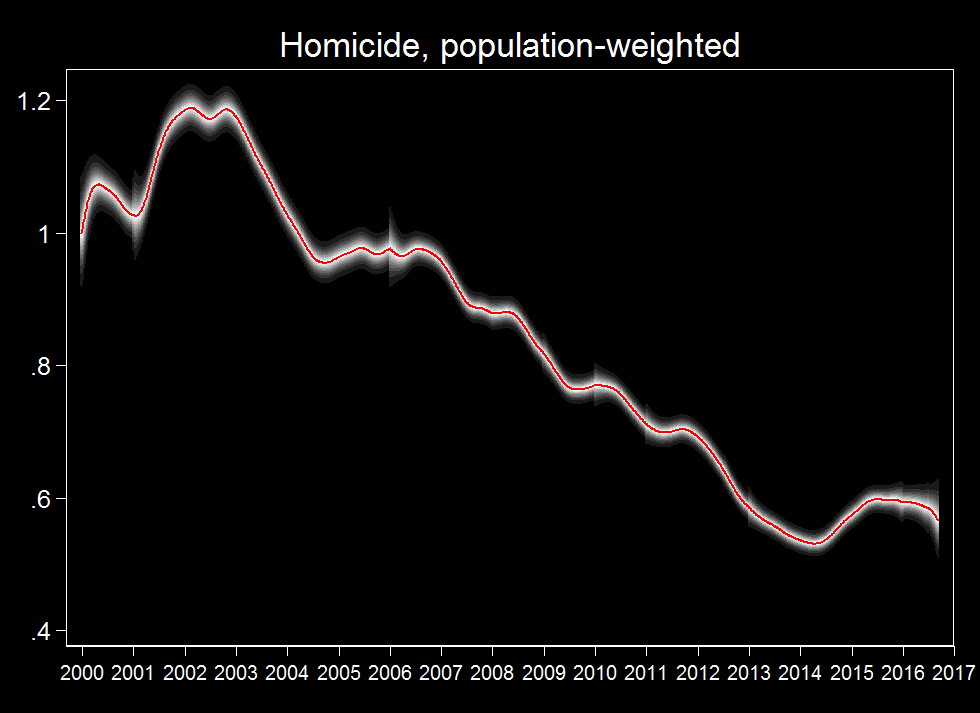
Cleansed of seasonal cycles, the homicide rate rose from mid-2014 to mid-2015. (The tick marks on the time axis indicate January 1 of each year.) However, since 2015, the seasonally adjusted homicide rate appears to have held steady. Possibly the elevated level—still low by the standard of recent history—is the new normal. Possibly the rate has peaked and will fall again, as cities such as Chicago and Baltimore successfully wrestle with local crime outbreaks. Or perhaps the rise will resume. Time will tell.
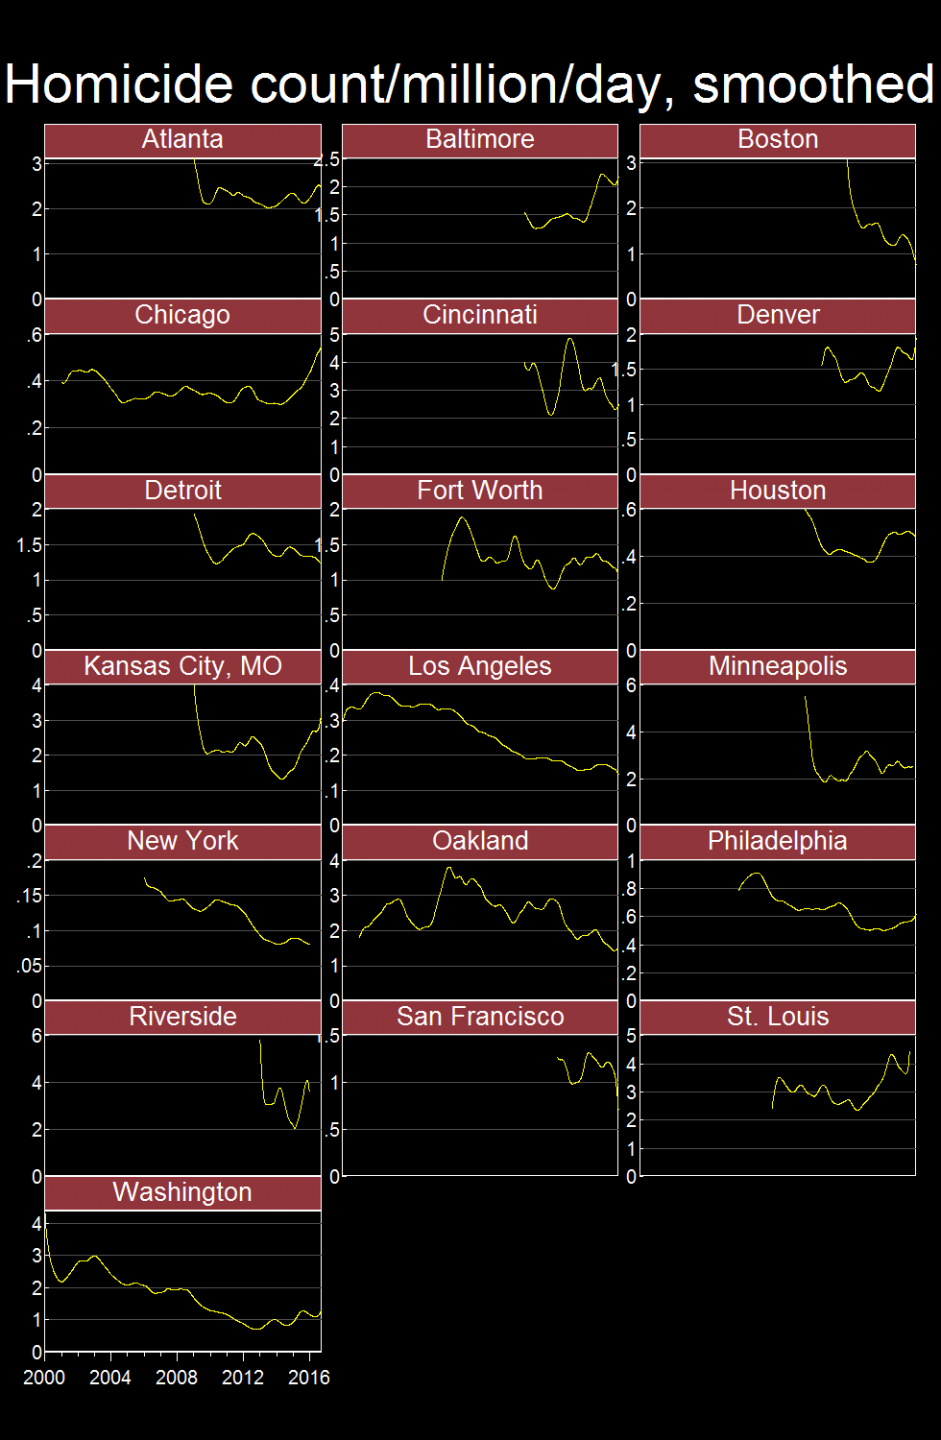
Here are the underlying trends by city–smoothed and seasonally adjusted. The curves are more volatile in smaller cities, where homicide is rarer in absolute terms:
In the FBI typology, the other kinds of violent crime are rape, robbery, and aggravated assault. (Robbery is violent because it is forcible theft from a person. “Aggravated” means “intended to inflict severe bodily harm,” usually through use of a weapon.) We have left out rape because the FBI broadened its definition in 2013, potentially creating spurious statistical shifts. Adding in robbery and aggravated assault gives this graph:
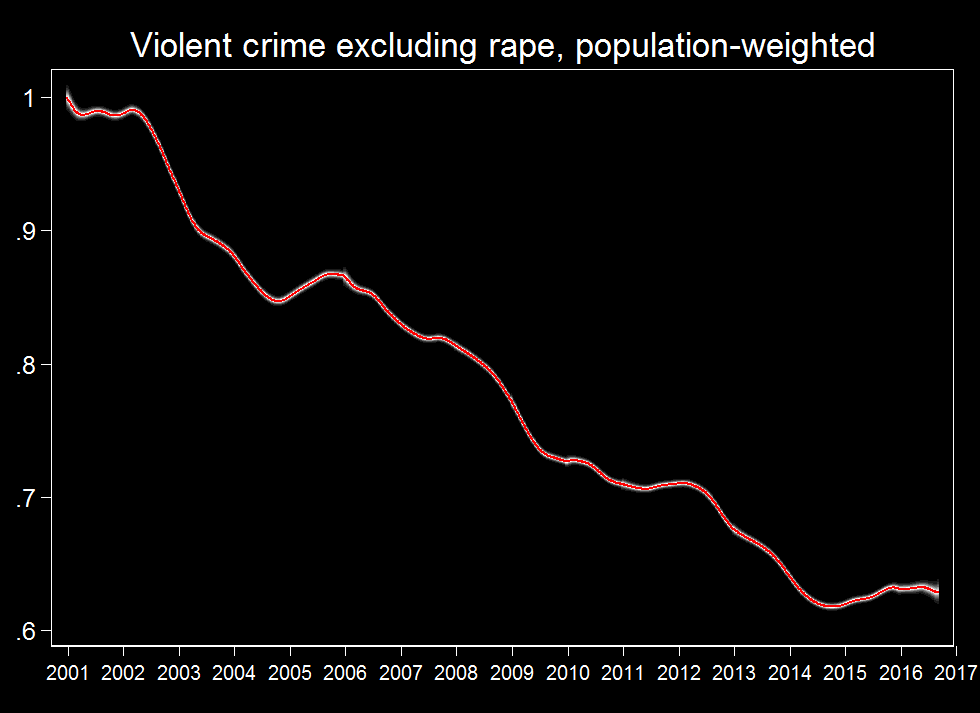
It appears that after falling about 40% since 2001, violent crime per capita has risen slightly since mid-2014.
The story looks different for the other major component of the FBI’s headline crime tally. Property crime is still falling in our sample:
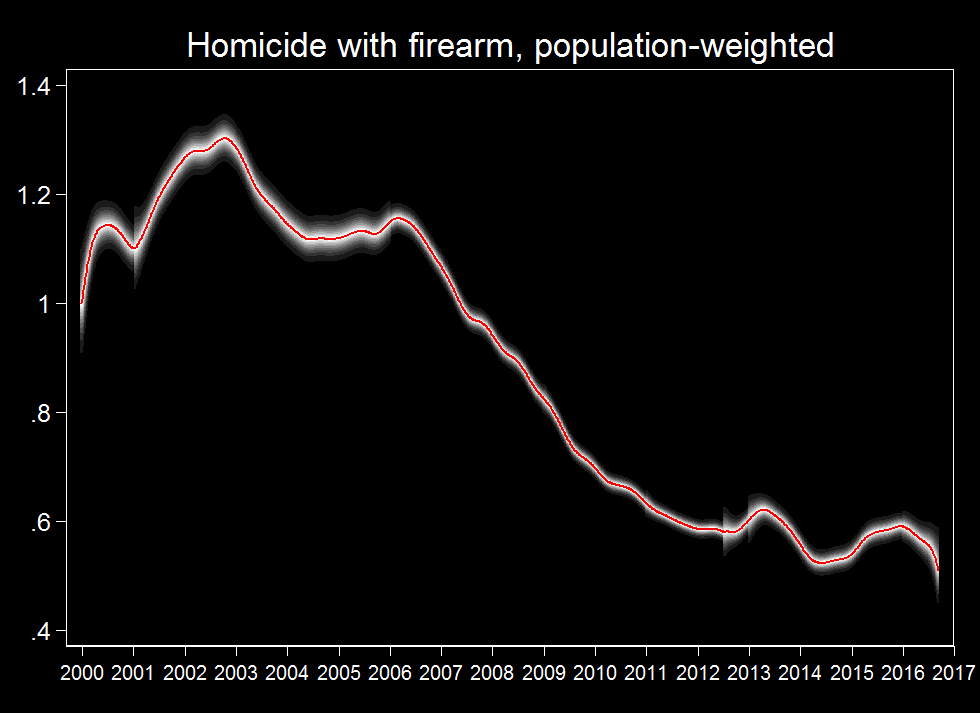
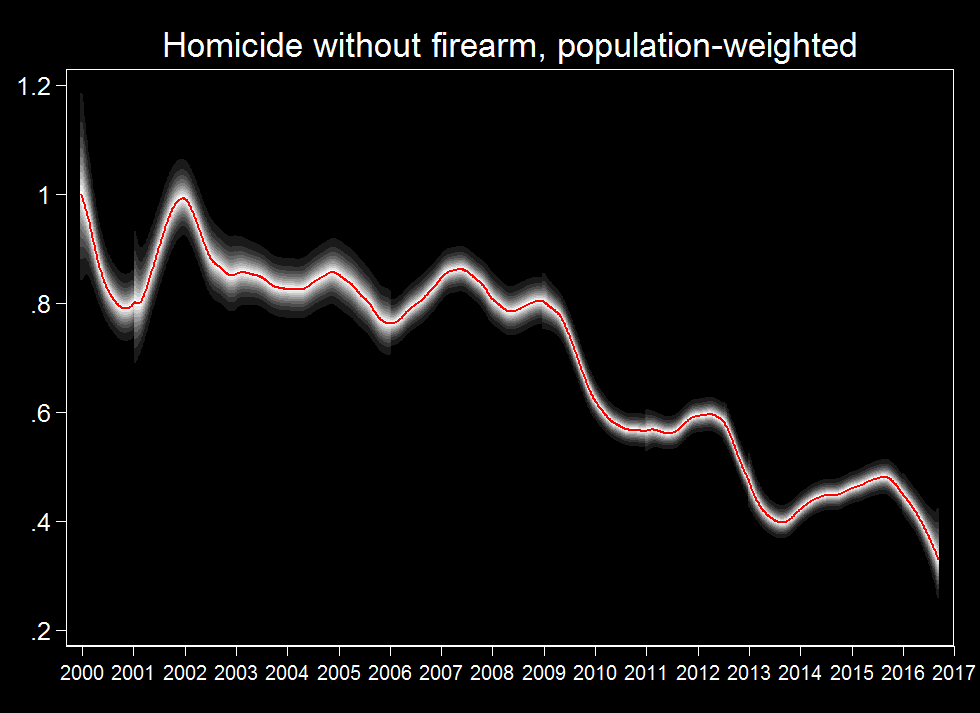
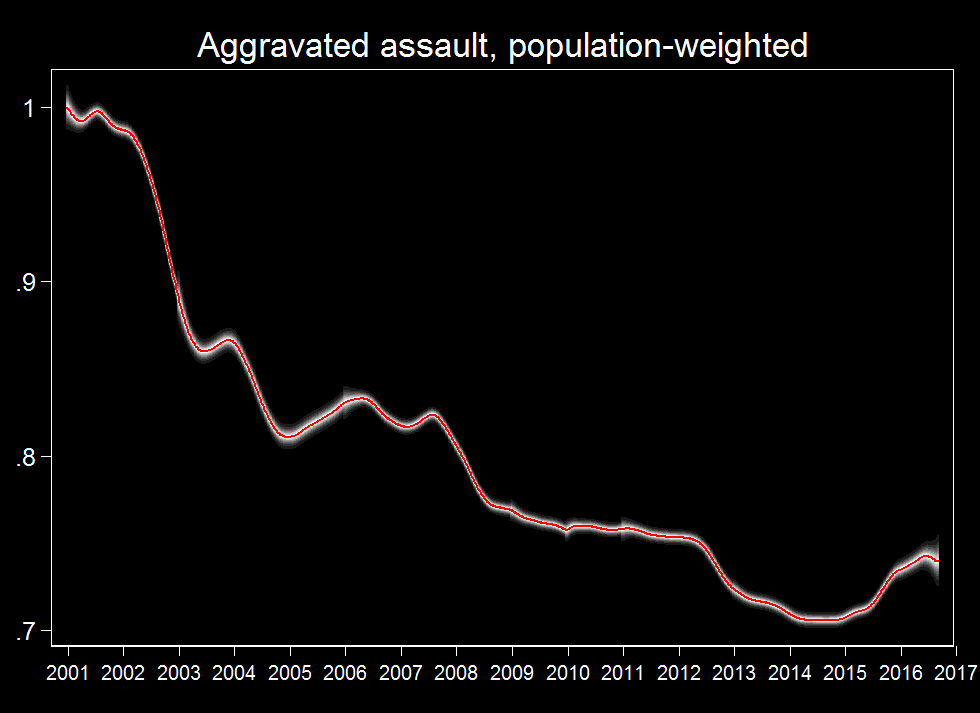
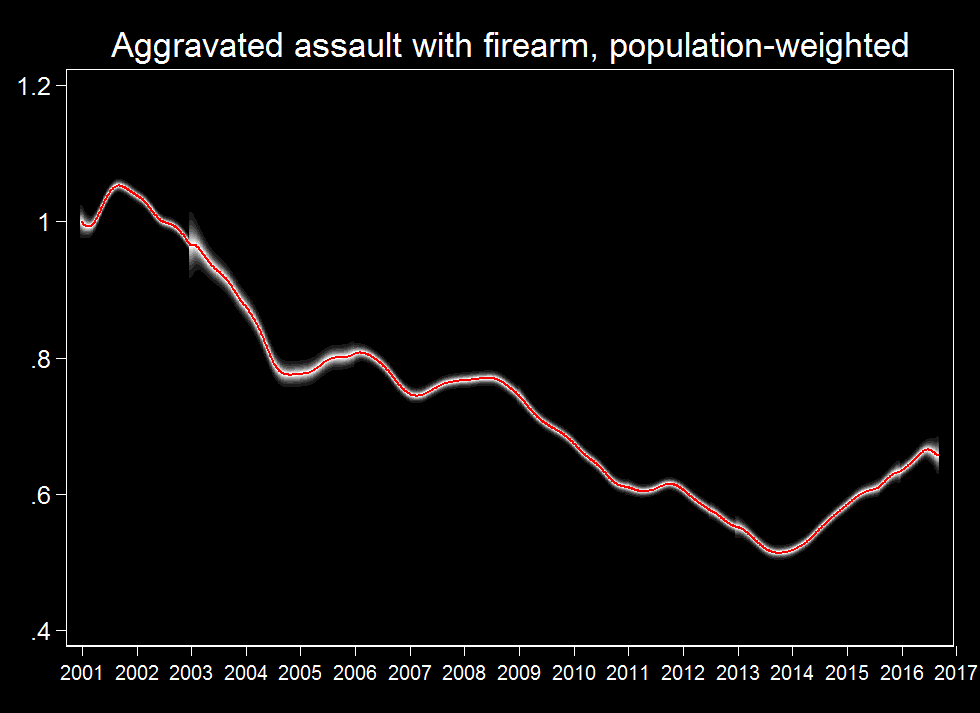
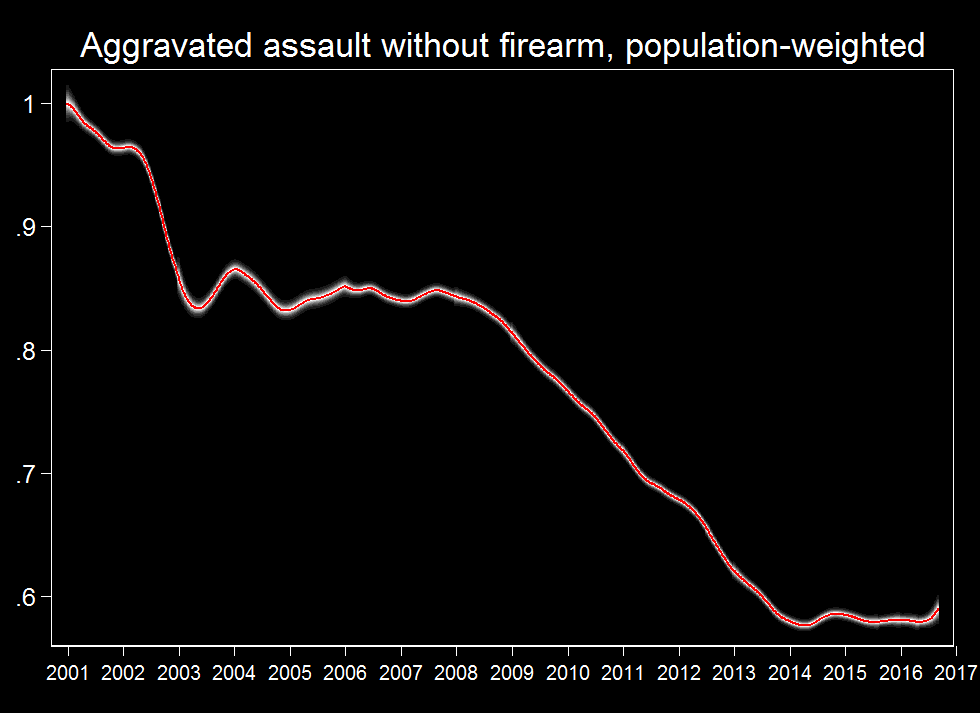
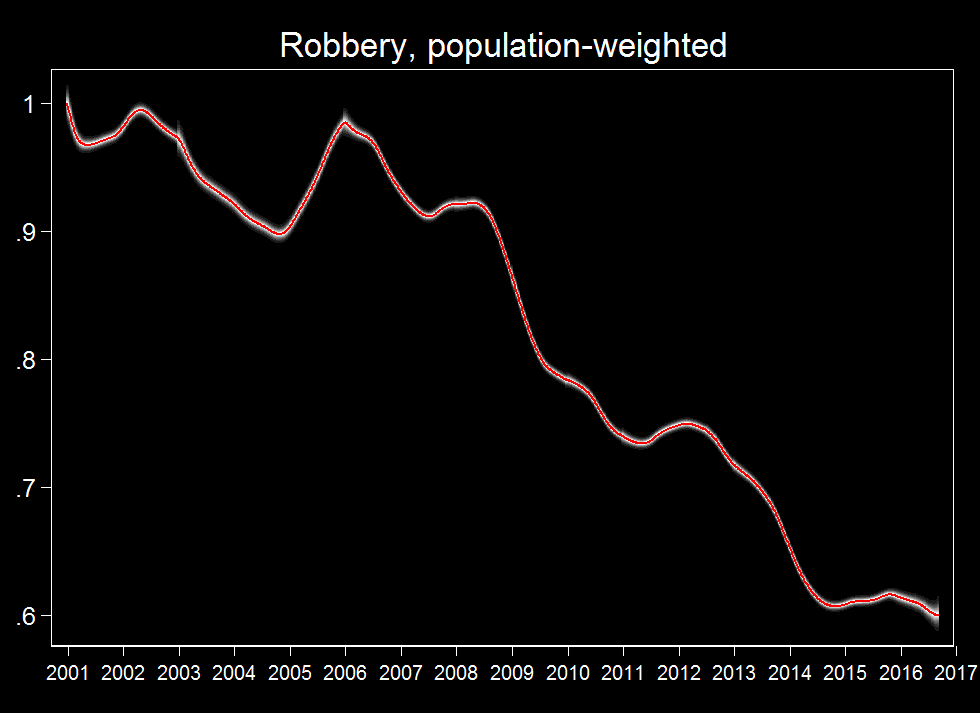
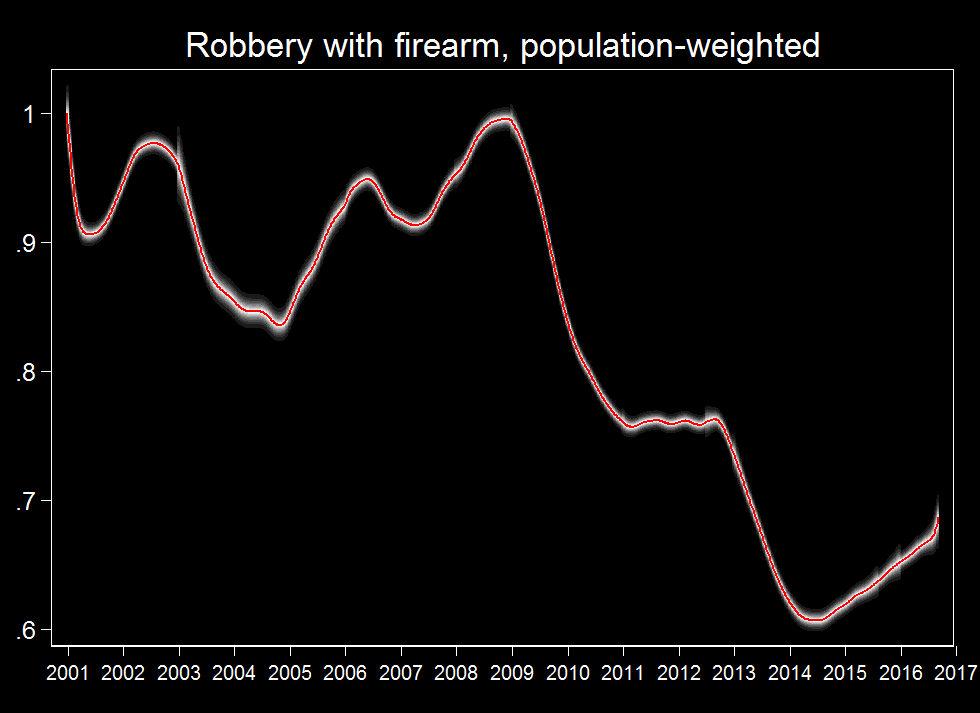
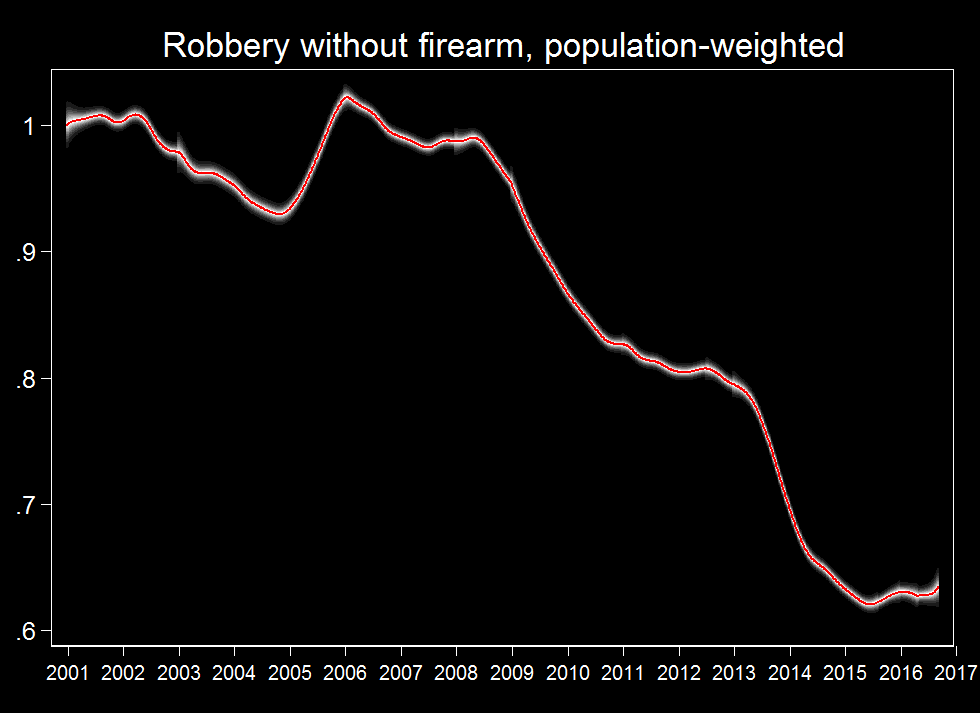
Here are graphs for other subcategories of crime, including ones breaking out by gun involvement. As the February post explains, changing the crime category also changes the sample, because we could not obtain data for all categories from all our cities. In general, crimes involving guns rose more or fell less than those not: