
Last year, we recommended $300 million of grants to GiveWell’s evidence-backed, cost-effective recommendations in global health and development, up from $100 million the year before. We recently decided that our total allocation for this year will be $350 million.
That’s a $50 million increase over last year, significantly driven by GiveWell’s impressive progress on finding more cost-effective opportunities. We expected GiveWell to identify roughly $430 million of 2022 “room for more funding” in opportunities at least 8 times more cost effective than cash transfers to the global poor. Instead, we estimate that GiveWell is on track to identify at least $600 million in such opportunities. However, due to reductions in our asset base, the growth in our commitment this year is smaller than the $200 million increase we had projected last fall.
The rest of this post:
- Reviews our framework for allocating funding across opportunities to maximize impact. (More)
- Discusses how changes in asset values influence the appropriate distribution of funding across our program areas. (More)
- Explains how we chose this year’s allocation to GiveWell, given our asset changes and GiveWell’s significant progress in finding more cost-effective opportunities. (More)
- Shares Alexander’s personal thoughts on why GiveWell seems like an unusually compelling opportunity for individual donors this year. (More)
Our framework for allocating funding across opportunities
We want to help others as much as we can with the resources available to us. When choosing how much funding to allocate — whether to GiveWell’s recommendations, or to other areas in global health and wellbeing — we think about how the choice will affect our funding options in future years.
If we had estimates of the cost-effectiveness of every grant we could possibly make this year, and similarly for each of the next 50 years, then we could take the following approach to maximize the impact of our spending and estimate our optimal threshold for cost-effectiveness:
- Rank all the opportunities (all 50 years’ worth[1]The 50-year horizon ensures that this analysis takes into account our funders’ desire to spend down their assets within their lifetimes.) in terms of their expected cost-effectiveness.[2]Of course, we’d have to discount future costs by the expected rate of return on assets, since we only need to set aside 1 dollar now in order to fund 1+r dollars of grantmaking next year. For example, if we expect a compounding 7% rate of return, a grant we’d make for $1 million in 2022 would … Continue reading
- Set aside funds for the most cost-effective grant, then the next most cost-effective, and so on, going down the list until we’d allocated all our resources.
- Look at the marginal grant that exhausts our resources, and use its estimated cost-effectiveness as the “bar” for all our other opportunities.
Of course, our cost-effectiveness estimates and predictions about the future aren’t nearly certain enough or granular enough to actually list every future opportunity. But we have done a very rough, abstract, assumptions-driven exercise (which we hope to publish in the next year) aimed at the same goals of figuring out what our “bar” should be and how to fund the most cost-effective opportunities across time.
One stylized finding from this exercise is that we can maximize our expected impact by setting a cost-effectiveness “bar” such that in any given year we spend roughly 8-10% of our remaining assets (of the assets we plan to eventually spend on interventions like GiveWell’s recommended charities).[3]This is the output of a Monte Carlo simulation approach, which we hope to write more about once we’re more confident in the model and findings. We simulate the interaction of many factors that could make our future spending more or less cost-effective. For example, some of our most cost-effective … Continue reading
How changes in assets influence optimal allocation across portfolio areas
In the hypothetical exercise above, we ranked each potential grant by its cost-effectiveness and then allocated our resources to the top grants, moving down the list until our resources were exhausted. If our assets were to shrink in value, they’d be exhausted further up the list, meaning that we’d fund fewer grants. Equivalently, since our cost-effectiveness “bar” is defined by the marginal grant, fewer resources means setting a higher bar for cost-effectiveness.
While we don’t have the information to actually do this exercise at the grant level across years, we can think about the implications for different portfolio areas. Some portfolios or categories of interventions will have many grants with cost-effectiveness near the bar. Those grants could be ruled in or out by small fluctuations in the bar, so our giving in those categories will be especially sensitive to changes in asset values. Others will have most of their grants far above or far below the bar, which means our giving in those categories will not be very sensitive to changes in asset values.
GiveWell’s recommendations are an example of the first kind of grantmaking category, and so in theory our giving to GiveWell-recommended charities should be especially sensitive to our asset values. That’s because, compared to most of our grantees, GiveWell’s work is highly elastic: its cost-effectiveness is not very sensitive to the annual scale of funding.
For example:
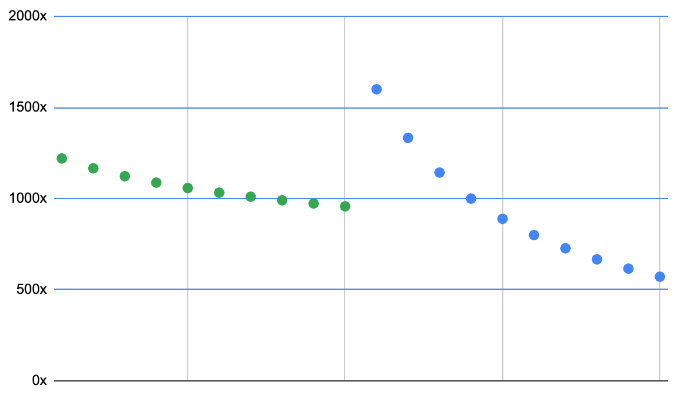
- If a charity focused on distributing bednets receives an extra $10 million, they can probably buy a lot more distribution, because this kind of work is highly scalable. Bednets are relatively easy to purchase and distribute; one might be able to spend a large amount of marginal funding at a similar level of cost-effectiveness by (for example) expanding to a new location with only slightly lower malaria prevalence.
- In other words, if the first $10 million in funding to this organization has a cost-effectiveness of 1100x, the next $10 million might be 1000x, because it buys a similar amount of distribution in a new location.
- By contrast, if a charity focused on researching new malaria treatments receives an extra $10 million, they may have a harder time “buying” more research, because this work isn’t as scalable. Even if the funding would pay for a dozen new researchers, there may simply not be enough relevant specialized candidates on the job market, which makes it hard to spend the money as effectively.
- In other words, even if the first $10 million in funding to this organization has a cost-effectiveness of 2000x, the next $10 million might be 500x, because it buys much less research.
This difference in elasticity means that a moderate change in our bar could rule out a lot of GiveWell grants while ruling out fewer grants in our other Global Health and Wellbeing (GHW) cause areas, which are more focused on research and advocacy.
How we chose this year’s allocation to GiveWell
Due to the recent stock market decline, our available assets have declined by about 40% since the end of last year,[4]This just reflects a decline in the market; our main donors are still planning to give away virtually all of their wealth within their lifetimes. which changes the optimal allocation across causes. All else being equal, our planned 2022 allocation to GiveWell should respond more than proportionally, while our allocation to less elastic portfolio areas should respond less than proportionately.
However, asset values are not the only thing that’s changed since we last projected our GiveWell support. As we noted above, GiveWell has found much more cost-effective opportunities over the last nine months than we or they were expecting.
Incorporating that update, and adjusting for various constraints on our current opportunity set,[5]The “abstract, assumptions-driven” model we described above assumes that our grantmaking opportunity set is fully isoelastic (i.e. cost-effectiveness and scale trade off at a fixed proportional rate, no matter how much or how quickly we scale up) and doesn’t distinguish between different … Continue reading our model suggests that the optimal cost-effectiveness bar for our Global Health and Wellbeing spending is roughly 1100-1200x in our units.[6]We refer to our bar using a multiplier — for example, using a “1000X” bar would mean we wanted each dollar of funding to have 1000 times as much impact as giving $1 to someone earning $50,000 per year. Our current bar is higher than the one we discussed last year because it reflects the … Continue reading That’s consistent with us giving roughly $250-$450 million to GiveWell-recommended charities this year, depending on various assumptions about the opportunities GiveWell finds and their fundraising from other sources.[7]Even without those sources of uncertainty, we’d have a fairly wide range of roughly-optimal amounts we could give this year. Our analysis suggests that giving $100 million more or less than the truly “optimal” amount to GiveWell-recommended charities only reduces our overall impact by roughly … Continue reading We don’t want our giving to create incentive problems by funging other donors,[8]For more on this point, see the “coordination issues” section of this post. so we’re committing now to a number in the middle of that range.
GiveWell’s increasingly cost-effective opportunity set means that, even though our available assets have fallen since the end of last year, and our allocation to GiveWell should respond more than proportionally, our planned 2022 support to GiveWell-recommended charities has fallen (from our original tentative plan) by less than asset values, and still grown in absolute terms.
Grants we’ve made to GiveWell’s recommendations this year include:
- Up to $64.7 million to Dispensers for Safe Water to install, maintain, and promote use of chlorine dispensers at rural or remote water collection sites. They project that this funding “will see us providing over 10% of Uganda’s population, and over 15% of Malawi’s, with access to safe water”.
- $14 million to Evidence Action to scope and scale potentially cost-effective interventions that don’t have clear existing implementers. In expectation, GiveWell believes this grant will open up roughly $40 million per year in new cost-effective funding opportunities by 2025.
- $8.2 million to Fortify Health to expand its partnerships with flour mills in India. The organization provides equipment and materials which allow its partner mills to fortify wheat flour with iron, folic acid, and vitamin B12 in an effort to reduce health issues like anemia and cognitive impairment.
- $5 million to PATH to support ministries of health in Ghana, Kenya, and Malawi in the implementation of the RTS,S malaria vaccine. GiveWell believes that financing this opportunity will speed up implementation by roughly a year in the areas covered by the grant, and could be similarly cost-effective to Malaria Consortium’s seasonal malaria chemoprevention program (a GiveWell top charity).
When our GiveWell spending growth is combined with growth in other Global Health and Wellbeing causes, including new programs in South Asian Air Quality and Global Aid Policy, we plan to spend more in 2022 than in any previous year, both in absolute terms and as a share of assets. We expect that growth to continue beyond this year.
Alexander’s final thoughts
When we published our initial plans for 2022, we were excited by GiveWell’s progress and eager to fund their future recommendations. Over the last nine months, they have exceeded our high expectations, which is why we are continuing to grow our support.
For other donors: I (Alexander) think it’s worth noting that GiveWell’s recommendations look very cost-effective this year. Compared to last year, we’d guess that their marginal recommendation this year will be ~20% more impactful; they also expect to have a sizable funding gap this year.[9]I feel some responsibility for the gap. I think that originally discussing our tentatively planned $500 million allocation for 2022, along with GiveWell’s related disclosure of their expectation that they’d be rolling funding forward on the margin in 2021, led some donors to hold off on … Continue reading
A few years ago, my wife and I contributed to a donor-advised fund to save for an exceptional future donation opportunity. This year, in addition to our standard annual giving, we plan to recommend half of the balance to GiveWell’s recommendations. I think that other donors interested in cost-effective and evidence-backed giving opportunities should take a close look at GiveWell this year.
Footnotes
| 1 | The 50-year horizon ensures that this analysis takes into account our funders’ desire to spend down their assets within their lifetimes. |
|---|---|
| 2 | Of course, we’d have to discount future costs by the expected rate of return on assets, since we only need to set aside 1 dollar now in order to fund 1+r dollars of grantmaking next year. For example, if we expect a compounding 7% rate of return, a grant we’d make for $1 million in 2022 would need to have roughly the same estimated impact as a grant we’d make for $2 million in 2032 for the two grants to be similarly ranked — because we could get roughly $2 million in 2032 by investing the $1 million now. |
| 3 |
This is the output of a Monte Carlo simulation approach, which we hope to write more about once we’re more confident in the model and findings. We simulate the interaction of many factors that could make our future spending more or less cost-effective. For example, some of our most cost-effective philanthropic opportunities will shrink over time as child mortality and global poverty decline, and the entry of new funders might mean there is less need for our spending in the future. On the other hand, waiting longer means we have more resources due to investment returns, and additional research might reveal new opportunities. Our current best estimate is that, for interventions like GiveWell’s recommended charities, our optimal strategy is to spend 8-10% of relevant assets each year.. This means that whatever level of assets we have, our cost-effectiveness “bar” for GiveWell-like interventions should be set so that the opportunities above this bar in the next year add up to 8-10% of such assets. |
| 4 | This just reflects a decline in the market; our main donors are still planning to give away virtually all of their wealth within their lifetimes. |
| 5 | The “abstract, assumptions-driven” model we described above assumes that our grantmaking opportunity set is fully isoelastic (i.e. cost-effectiveness and scale trade off at a fixed proportional rate, no matter how much or how quickly we scale up) and doesn’t distinguish between different categories of GHW spending.
More realistic constraints would, among other effects, limit how much we can spend in the next few years on non-GiveWell opportunities. For example, if we set the goal “quadruple our planned spending in 2023”, we’d probably have to set a much lower bar for that year. By contrast, if our goal was “quadruple our planned spending over the next decade”, we probably wouldn’t have to lower the bar as much (since we’d have more time to build a strategy around the new goal). |
| 6 | We refer to our bar using a multiplier — for example, using a “1000X” bar would mean we wanted each dollar of funding to have 1000 times as much impact as giving $1 to someone earning $50,000 per year. Our current bar is higher than the one we discussed last year because it reflects the update from assets declining and GiveWell finding more cost-effective opportunities than we expected, both of which raise the optimal bar. |
| 7 | Even without those sources of uncertainty, we’d have a fairly wide range of roughly-optimal amounts we could give this year. Our analysis suggests that giving $100 million more or less than the truly “optimal” amount to GiveWell-recommended charities only reduces our overall impact by roughly as much as if we’d spent $5 million of our GHW assets to have zero impact.
The impact of small deviations from the optimal path is small because, if we were perfectly optimally allocated across categories (and years) of spending, the marginal cost-effectiveness would be equalized for each category — that is, an extra dollar of giving would accomplish the same amount of good, no matter which year or category we allocated it to. Therefore, if we get our allocations a bit wrong, but are still near optimal, those deviations don’t reduce our impact too much. (Very roughly, they reduce our impact by the amount misallocated, times half the difference in marginal cost-effectiveness between the misallocated category and our overall “bar”. That’s because impact is the area under the cost-effectiveness curve, which is roughly approximated by a triangle at these scales.) |
| 8 | For more on this point, see the “coordination issues” section of this post. |
| 9 | I feel some responsibility for the gap. I think that originally discussing our tentatively planned $500 million allocation for 2022, along with GiveWell’s related disclosure of their expectation that they’d be rolling funding forward on the margin in 2021, led some donors to hold off on donations they might otherwise have made. While we still think it was correct to share our projections with GiveWell in order for them to plan correctly, we should have done more, privately and publicly, to emphasize that our plans were tentative, and that GiveWell could readily end up with more exciting grant opportunities than funding to fill them. |